Tracing and Metrics
Tracing
The tracing can be activated and set up in the waveware server via the DataManagement. You can use this feature to collect timing data needed to troubleshoot latency issues in rule development. Click on the 'Telemetry' button in the DataManagement ribbon.

Check the option 'Activate tracing', save and continue with setup.
'Jaeger' and 'Zipkin' applications are supported to process the results and display the data. The applications should be run on the server on which the waveware server is also running.
-
Jaeger
Download the application (https://www.jaegertracing.io/download/) and unzip the "jaeger-all-in-one.exe" in any direcotry, e.g. "C:\Temp\wavewareTracing"Before doing so, make sure that Windows Firewall allows incoming connections via the required ports (16686, 4317).- Live Tracing
Open a command line (CMD) and run the "jaeger-all-in-one.exe" with the parameter "--collector.otlp.enabled". Using any browser, you can view trace data locally and instantaneously at the "http://localhost:16686" link.

- Save data of the tracing
To save the determined process data in files, create a directory with the sub-folders "values" and "keys", e.g. "C:\Temp\wavewareTracing\trace\values" and "C:\Temp\wavewareTracing\trace\keys".- Open Windows PowerShell and change to the directory of "jaeger-all-in-one.exe".
- Set the following environment variables:
$env:SPAN_STORAGE_TYPE ="badger"
$env:BADGER_EPHEMERAL ="false"
$env:BADGER_DIRECTORY_VALUE ="C:\Temp\wavewareTracing\trace\values"
$env:BADGER_DIRECTORY_KEY ="C:\Temp\wavewareTracing\trace\keys"
$env:BADGER_SPAN_STORE_TTL ="168h"
- Start the 'jaeger-all-in-one.exe' in this Powershell.
./jaeger-all-in-one.exe --collector.otlp.enabled

The trace data is now stored in files in the two directories. The data can be evaluated for 168 hours. If a longer period of time is necessary, the environment variable "BADGER_SPAN_STORE_TTL" must be adjusted accordingly. To evaluate the data from the files, also start the "jaeger-all-in-one.exe" with the above environment variables and adjust the paths accordingly.
- More information and documentation for Jaeger [extern]: https://www.jaegertracing.io/docs
- Jaeger on another computer
If Jaeger is not to be run on the same computer on which the waveware server service is running, the corresponding IP address or host name must be entered in DataManagement under Jaeger 'Endpoint URL' (e.g. "http:// MyWavewareServer:4317/").
The website for live tracing can then also be accessed under this IP address or host name with port 16686 (e.g. "http://MyWavewareServer:16686/"). - Another port for sending tracing data
By default, port 4317 is used to transmit data. If you change the port in Jaeger, the Jaeger 'endpoint URL' in DataManagement must also be adjusted (e.g. for port 4300: "http://MyServer:4300/").
When starting the "jaeger-all-in-one.exe" you pass the new port with the parameter "--collector.otlp.grpc.host-port". The call could then look like this, for example:./jaeger-all-in-one.exe --collector.otlp.enabled --collector.otlp.grpc.host-port=:4300
- Live Tracing
-
Zipkin
Zipkin is preferably deployed via Docker. Therefore, in order to use Zipkin, you need a pre-set up, working Docker environment (https://www.docker.com/) on the local server.- Open the command line (CMD) and run the following command to start Zipkin as a Docker container:
docker run -d -p 9411:9411 openzipkin/zipkin

- If the Docker container is running on the local system, you can then retrieve trace data via the following link in the browser: "http://localhost:9411"

- More information and documentation for Zipkin [external]: https://zipkin.io/pages/quickstart.html
- Open the command line (CMD) and run the following command to start Zipkin as a Docker container:
Metrics
You can activate metrics in the waveware server via the DataManagement. Click on the 'Telemetry' button in the ribbon to make settings in the 'waveware metrics' area.
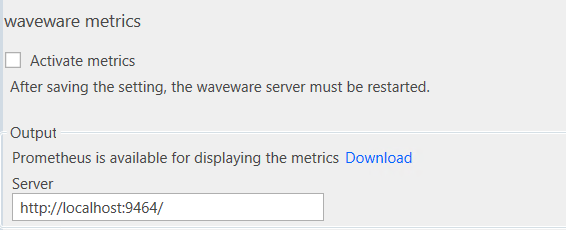
Check the 'Activate metrics' option, save and continue with the setup.
The 'Prometheus' application is supported for outputting the metrics. The application must be run on the server on which the waveware server is also running.
- Download the application (https://prometheus.io/download/) and unzip it in any directory, e.g. "C:\Temp\prometheus".
- In this directory, create a configuration file "otel.yml" with the following content:
global:
  scrape_interval: 1m
  scrape_timeout: 1m
  evaluation_interval: 10s
scrape_configs:
  - job_name: "otel"
    static_configs:
      - targets: ["localhost:9464"]
Be sure to format the .YML file correctly. Line indentations must be transferred correctly. - Open Windows PowerShell or command line and navigate to the directory where the configuration file and the 'prometheus.exe' are located. Run the following command to start the application along with the configuration file:
./prometheus.exe --config.file=otel.yml
- Then the metric data can be called up in the local browser via the "http://localhost:9090" link.